The Relative Harm #
Obscured by the endless stream of hysteria, misinformation and outright lies, which have been promulgated by the mainstream media* for generations, are the answers to the most fundamental of questions:
What are the relative harms of the most commonly used psychoactives?
What does the DATA actually say?
What does SCIENCE tell us?
What are the FACTS?
Every adolescent who has ever dabbled with cannabis already has some sort of a handle on this. Their own experience and those of their peers directly contradicts the propagandistic mendacity they have been subjected to. They are aware that the drugs they have personally encountered are not the toxically guaranteed path to a wasted life they are presented as.
Simultaneously, they can see the perils of alcohol with their own eyes. Often, the debris and fallout is all around them.
Hardly surprisingly, this real world picture of first hand experience is broadly the one which scientific studies substantiate and confirm. It is a stark and clear picture: a picture which is generally hidden from the public at large.
SCIENTIFIC APPROACHES #
There are many approaches with which to measure the relative harms of individual psychoactives. These range from those focused upon the individual, such as addiction potential and toxicity, to those which address wider social issues, such as crime and healthcare. By and large, it is fair to say that the ranking of commonly used substances (legal and illegal) does not differ dramatically between them.
To illustrate this, I present below data from a number of the studies which have been undertaken over the years, some of which has been reported and submitted directly to Parliament.
The first illustration uses data sourced from a paper by Robert S. Gable, called “Comparison of acute lethal toxicity of commonly abused psychoactive substances”, which was published by the Society for the Study of Addiction, in 2004. This presents the ratio of effective dose to lethal dose.
* Honourable exceptions acknowledged.
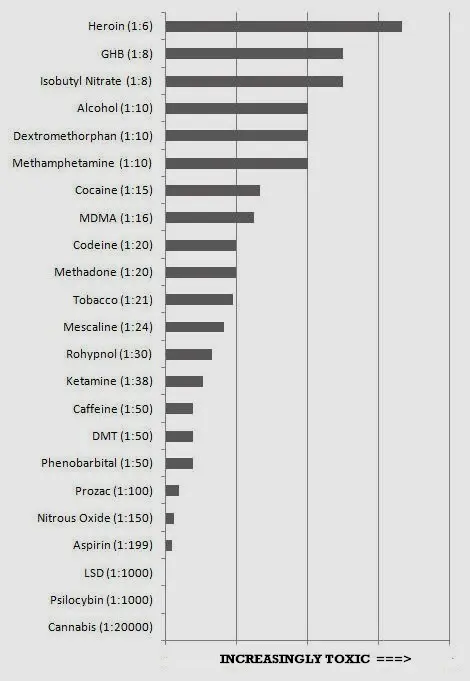
In plain English, whilst two drinks may make you merry, twenty may well kill you. Hence, the ratio for alcohol in this diagram is 1:10.
Now consider the following graph. The underlying data was produced by Prof David J Nutt, FMed, Leslie A King, PhD, Lawrence D Phillips, PhD, on behalf of the Independent Scientific Committee on Drugs and was published in The Lancet,Volume 376, No. 9752, p1558–1565, 6 November 2010 (Drug harms in the UK: a multicriteria decision analysis).
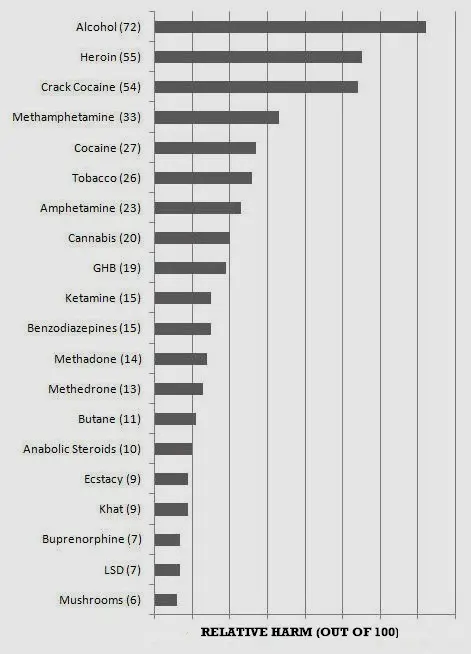
The methodology was described thus: “Members of the Independent Scientific Committee on Drugs, including two invited specialists, met in a 1-day interactive workshop to score 20 drugs on 16 criteria: nine related to the harms that a drug produces in the individual and seven to the harms to others. Drugs were scored out of 100 points, and the criteria were weighted to indicate their relative importance.”
Wikipedia describes this as follows:
“Researchers asked drug-harm experts to rank these illegal and legal drugs on various measures of harm both to the user and to others in society. These measures include damage to health, drug dependency, economic costs and crime. The researchers claim that the rankings are stable because they are based on so many different measures and would require significant discoveries about these drugs to affect the rankings.”
The graphic below was produced from data offered in another article published by The Lancet, this one on March 24, 2007, by Prof David Nutt, FMed, Leslie A King, PhD, William Saulsbury, MA, Prof Colin Blakemore, FRS ("Development of a rational scale to assess the harm of drugs of potential misuse" - 369:1047-1053).
![[Ref: https://commons.wikimedia.org/wiki/File:20drugs.png]](/images/image544.jpeg)
Finally, the following two charts were created simply to illustrate a couple of extremes, in terms of drug use and fatality.
![[Source Data: Schaffer Library of Drug Policy]](/images/image545.jpeg)
Annual Drug Deaths in the United States
[Source Data: Schaffer Library of Drug Policy]
![[Source Data: Office of National Statistics]](/images/image546.jpeg)
Annual Drug Deaths in the United Kingdom
[Source Data: Office of National Statistics]
The picture presented by all these charts is more or less the same as that painted by every study I encountered. The implications of this are obvious:
- The legal status of psychoactives bears no relation whatsoever to harm or health. This could hardly be more clear-cut.
- In terms of personal harm, the usual suspects (e.g. heroin, alcohol) are at the same end of the spectrum. Psychedelics, of course, are at the opposite end.
Whilst each chemical and botanical should always be researched on its own merits, data such as this is hard to ignore, unless you are a politician or part of the mainstream media.